By analyzing the distrubition of asiists, goals, and game winning goals across each position, we derive a unique insight into the offensive contributions of each. An analysis by Andy Brennan!

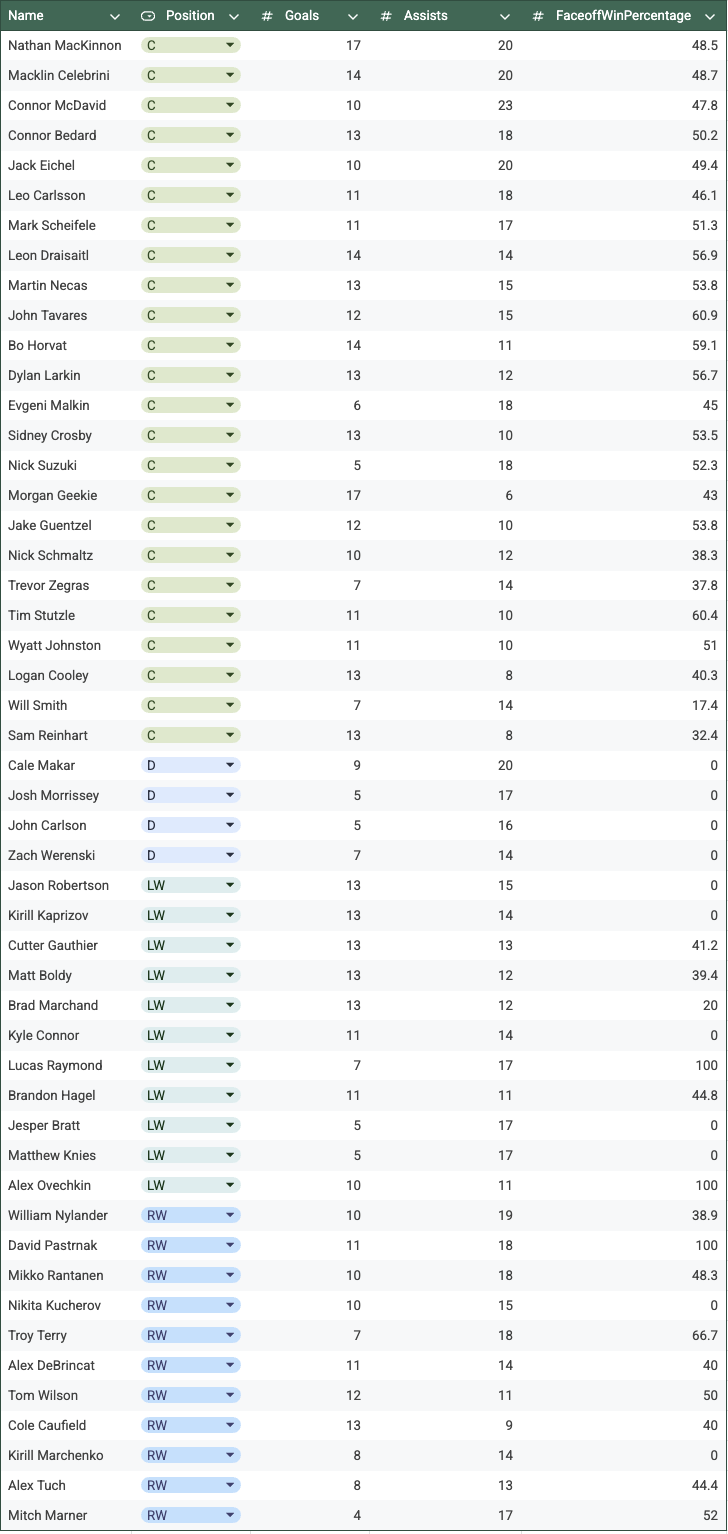
The Data
NHL Assists % by Position
■ Right Wings (RW) — 24.5%
Right wings contribute the fewest assists of the four positions, though the difference is minimal.
■ Left Wings (LW) — 25.0%
Left wings sit just behind centers and defensemen. Wings play a key role in board battles and cycle play.
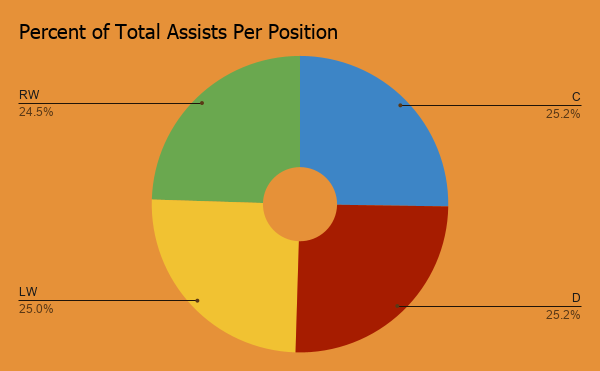
■ Centers (C) — 25.2%
Centers lead all positions by a slim margin. Their role at the middle of the ice gives them slightly more assist opportunities.
■ Defensemen (D) — 25.2%
Defensemen are tied with centers at the top, which reflects how modern NHL blueliners contribute heavily to offense.
NHL Goals by Position
■ Right Wings (RW) — 20.0%
Right wings account for the second-fewest goals among skaters. Their role often emphasizes positioning and net-front presence over volume shooting.
■ Left Wings (LW) — 21.9%
Left wings contribute slightly more goals than right wings, benefiting from strong-side shooting opportunities and cycle play down low.
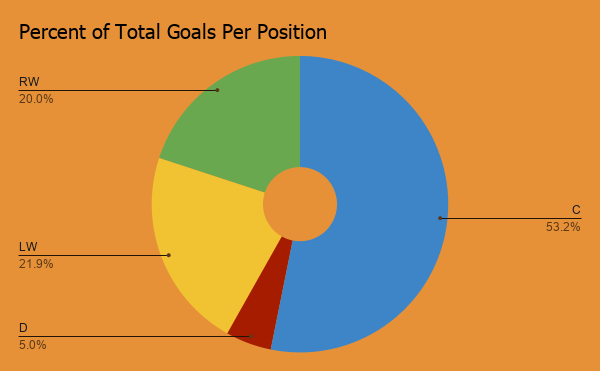
■ Centers (C) — 53.2%
Centers account for over half of all NHL goals. Their involvement in nearly every offensive sequence gives them a massive scoring advantage.
■ Defensemen (D) — 5.0%
Defensemen score the fewest goals by far, consistent with their primary role in zone coverage from the point rather than finishing plays.
NHL Face Off Win % by Position
■ Left Wings (LW) — 44.1%
Left wings win fewer than half of their face offs on average. They are rarely the primary face off taker, often deployed in a support role.
■ Right Wings (RW) — 42.1%
Right wings post the lowest win percentage of all positions. They are infrequently used as face off specialists and tend to lose the battles they do take.
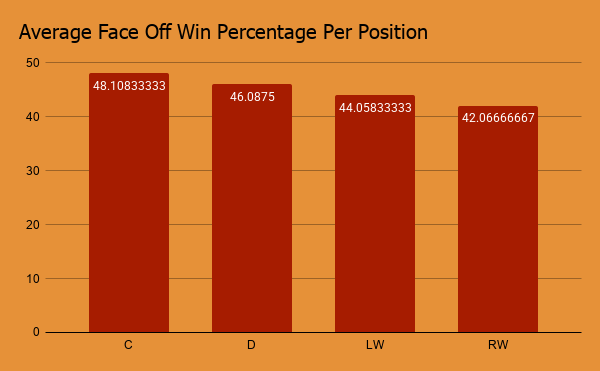
■ Centers (C) — 48.1%
Centers lead all positions in face off win percentage, coming closest to 50%. This tracks, as they are specifically trained and deployed for this skill.
■ Defensemen (D) — 46.1%
Defensemen rank second, weirdly, though rarely they take face offs. When they do step in, they seem to perform at a competitive rate.
Key Takeaways
When viewed together, these three charts show how offensive contributions are distributed across NHL positions.
Since assists are split almost perfectly evenly, we can conclude that playmaking is a shared responsibility across the roster. Goals, however, show something else. Centers account for over half of all goals scored, while defensemen contribute just 5%. This contrast reveals that while setting up plays is a team wide effort, finishing them is heavily concentrated to the center position. Though, it is their job, so this is unsurprising. Centers not only lead in goals but also win puck battles at the highest rate, reinforcing their role in possession and production. More shockingly, Defensemen rank second in face off win rate despite rarely taking them, while wingers on both sides struggle to crack the 45% mark.
Taken together, the data suggests that centers are by far the most complete offensive contributors in the modern NHL. For teams who prioritize offense, building around elite centers gives a structural advantage in both puck possession and goal scoring.
Data Utilized